


When Models Break: A Framework for Understanding Regime Change in Real Time
A guide to understanding whether the recent market turmoil is temporary, or the start of a new regime in markets

It’s been a wild two weeks in markets—arguably the most eventful stretch since the SVB collapse, and, frankly, there’s much more going on this time around. Initially, I planned to write a Substack piece exploring how to model regime changes and identify the tipping points when markets transition into a new state. I built a model two weeks ago, started drafting the post, and then—Liberation Day happened. Volatility exploded, and when I revisited the model, it signaled that we had, in fact, crossed into a new regime. So this isn’t the post I intended to write. Instead of backtesting a model with out-of-sample data, I’ve reworked it to examine what’s happening right now. This is perfect live-testing for the model. Now the model isn’t all that complex—and it is certainly possible that it is wrong going forward. However, it is relatively simple and has a fundamental underpinning.
A brief, last second note: This was written prior to President Trump’s announcement that tariffs will be temporarily suspended.
Roadmap
Fundamental Underpinning of the Model
The Regime Change Model
Hypotheses
Model Testing and Regime Comparisons
The Future
Fundamental Underpinning of the Model
I’ve previously written about regime changes in financial markets and defined weak economic regime changes as “any broad-scale change in market returns and correlations [which] can be measured as starting during periods of excessive variance.” I hope you forgive me for my hand-wavy explanation of regime changes then and today, perhaps I will finally be granted forgiveness as I attempt to more rigorously define and test this theory. My previous post on regime changes was backward-looking, probably overfit, and wasn’t particularly helpful at forecasting the future. Today, we will change that.
Variance matters because not all moments in markets transmit the same amount of information—some days (CPI releases, FOMC meetings, or sudden geopolitical shocks (Liberation Day?)) fundamentally reshape investor expectations, while others pass with little new insight. In traditional models, time is treated uniformly—each day holds equal weight. But this ignores that markets digest and reprice information unevenly across time. High-variance periods reflect moments when uncertainty is elevated and expectations are shifting—when the market is actively “learning.” These moments are dense with information, and it’s precisely during these phases of heightened variance that economic or financial regimes are likely to shift—pushing us to a new equilibrium. Old relationships (stock-bond correlations) break down, new ones emerge, and models become unstable. Regime changes often aren’t just reactions to isolated data—they are the culmination of an information wave, a repricing of the future.
Using variance as a trigger for identifying regime changes should work because variance is a reflection of markets actively digesting new, conflicting, or surprising information. Regimes shift when the underlying assumptions about growth, inflation, policy, or risk are no longer stable, and this instability is exactly what drives volatility higher. In essence, variance is the signal that the current equilibrium is breaking down. By looking at variance we can isolate the periods when markets are most likely reassessing their priors and rewriting their internal logic. From this view, surges in volatility may reflect a transition to a new state.
The Regime Change Model
I start from the null hypothesis that there have been no regime changes—markets have been chugging along in the same “regime” for the last 75 years. My alternative hypothesis is that regime change occurs after a period of significant volatility in financial markets. It is necessary to first define “significant volatility.” Previously, I defined high volatility years as years in which the average monthly volatility was in the 90th percentile or greater over my sample period. This, admittedly, introduces look-ahead bias as I am using future data (the total sample) to understand where volatility sat at a past date. I fix this here by defining a period as high-volatility if its average monthly volatility was 2.5 or more standard deviations above an exponentially weighted moving average of the trailing periods (half-life of 4 years). By defining volatility this way, we remove the look-ahead bias from using future data in understanding past volatility. It also is probably a good measure of a departure from normal times.
Now that we have defined “high-volatility periods” we need to actually test whether these periods are predictive of regime changes. And, to do that, we need to precisely define what we mean by “regime changes.” Moreover, we don’t just want to backwardly-look at and classify regime changes, we want to be able to understand, in the moment, when a regime change is happening. This is a relatively complicated problem! I propose the following solution. We first define equity market regime changes as significant changes in returns, volatilities, and correlations of equities with bonds, the dollar, and commodities (we will use oil and gold as proxies for simplicity here). Returns, volatilities, and correlations will be measured at a daily frequency.
Our alternative hypothesis is that high volatility periods precede regime changes. We have already classified our high volatility periods and for returns and volatilities, we will compare the distributions from the separate periods both by visualization and statistics (t-tests). We will also visualize the correlations. Thus, if we have defined regimes from January 1990-December 1999 and January 2000-December 2009, then to determine whether there is a regime change, we will compare returns, volatilities, and correlations in regime 2 (January 2000-December 2009) to regime 1 (January 1990-December 1999). If we see significant changes, we may conclude that there was a regime change.
Regime changes have significant implications—models and strategies that worked in one regime may be rendered obsolete in the next regime. Thus, if we can understand quickly whether we are entering a new regime, we can turn off (or alter) strategies and algorithms before they lose significant money. Extremely importantly, if we can be precise about what regime change will occur next, we can be immensely successful. Thus, if we can quickly tell, after the high-volatility period, something specific about the new regime, we can harvest some Informational Advantage Alpha from those who haven’t properly adapted to the new regime yet.
Hypotheses for Regimes
The thesis is that regime changes occur after periods of significant volatility. With “significant volatility” defined as monthly volatility 2.5 standard deviations above the mean, I have plotted the following chart showing the cutoffs for each “regime” (Figure 1).1 Figure 2 shows the periods of each forecasted “regime.”2 One must remember that these aren’t official regimes yet, just hypotheses of different regimes using the hypothesis that regime change occurs after periods of high volatility.
Figure 1: Time Series of Model Defined Equity Market Regime Changes

Figure 2: Model Defined Regime Changes

Model Testing and Regime Comparisons
So, originally, I aimed for this piece to test the thesis in each regime. With the frame of the piece shifting, that seems like overkill and probably too boring. However, it is important to understand whether these regime measures are good partitions. That is, do they work? So, rather than go through each “change” in excruciating detail, I’ll summarize my findings very quickly. Anyone who wants to learn more or understand the work done here can message me and I will be happy to go over it.
Very simply, I compared all regime comparisons visually—trying to understand if they really were separate regimes—before looking into the statistics. For all volatility comparisons between regimes, I used a simplified version of the Parkinson Volatility Estimator. I wasn’t able to get high-quality data for all comparisons going back through the whole time series, so throughout the piece, I only made data comparisons when I had full data for both regimes. I have visualizations for every regime and since it would be too much to put in every chart here, I will send them to anyone interested. Here are a few examples of the plots.
Figure 3: Visualization of Regime 10 to Regime 11 Looking at Stock/Yield Correlations
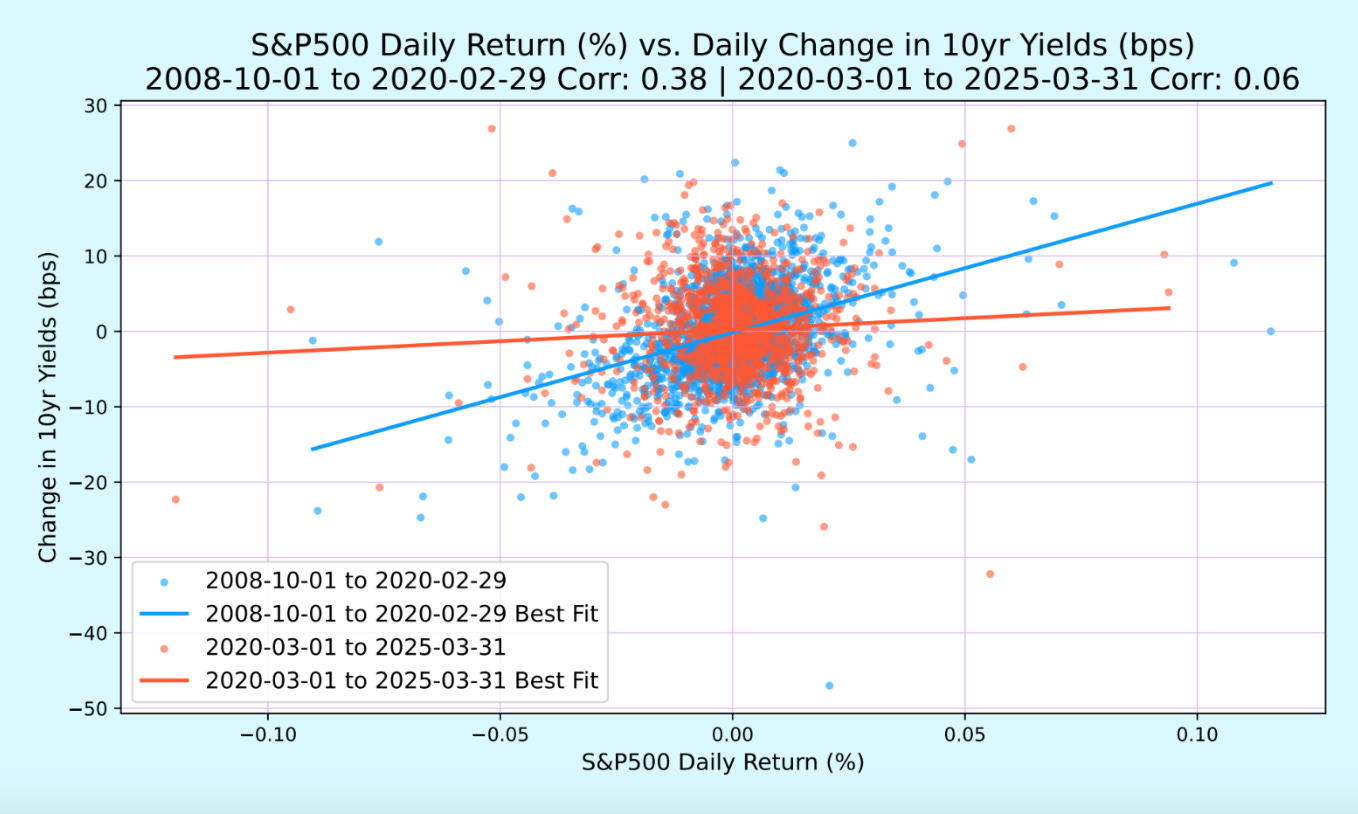
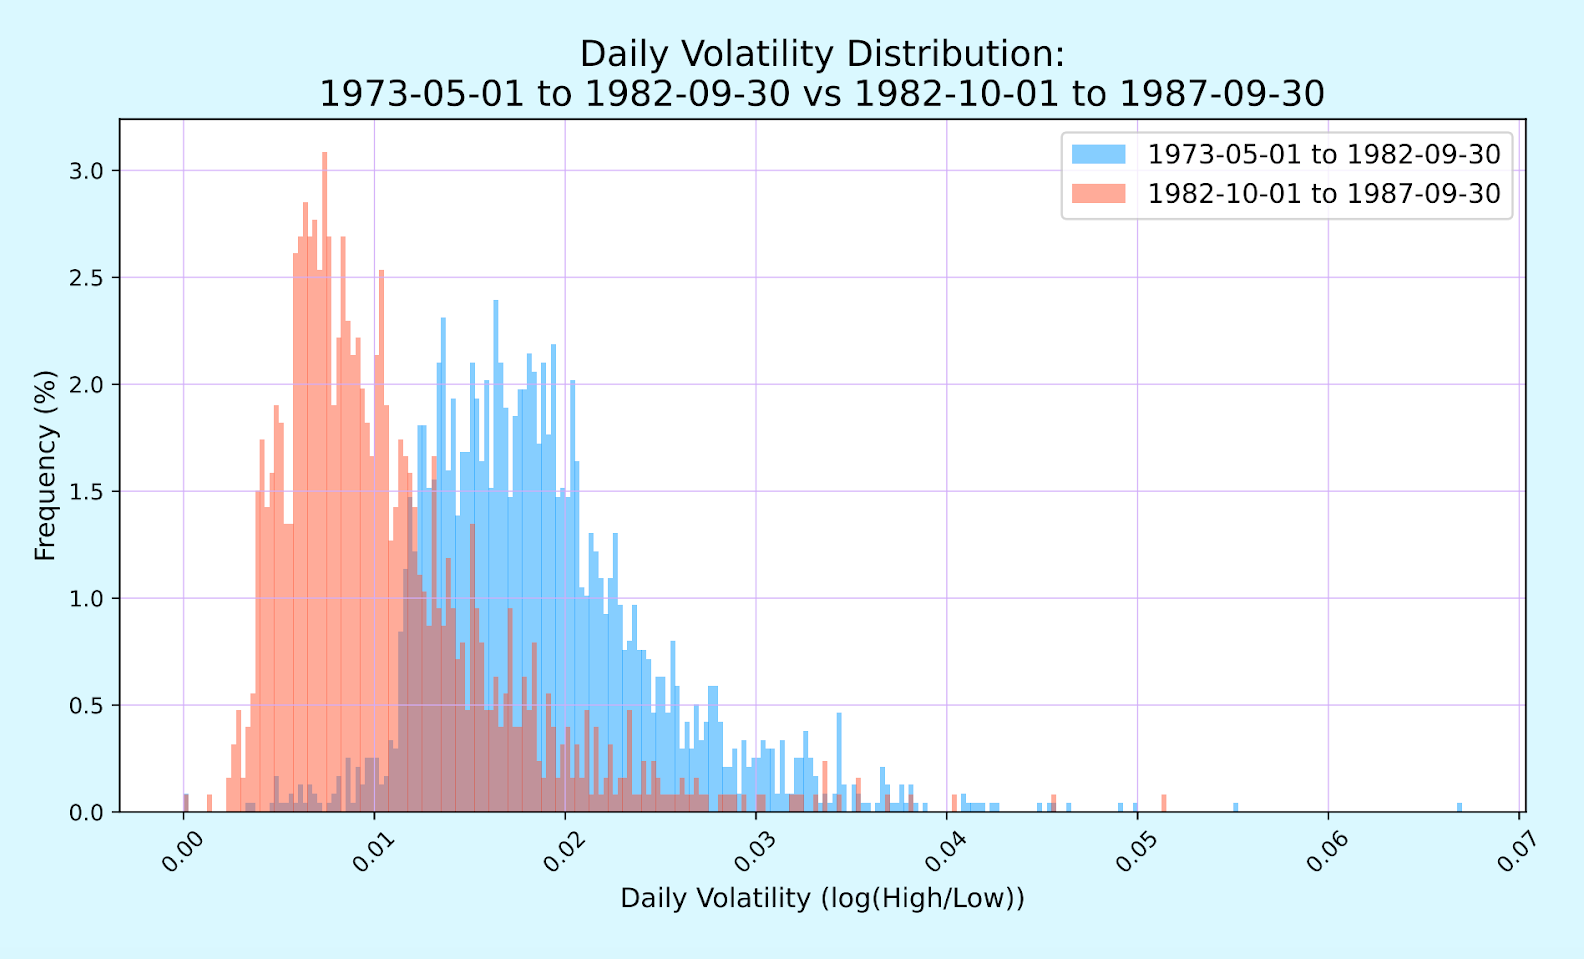
Figure 4: Visualization of Regime 5 to Regime 6 Looking at Volatility Comparisons
And here is the consolidated data. Overall, it appears the model does a pretty good job of partitioning regimes—and does so without look-ahead bias. All data is calculated daily. Returns and volatilities are annualized for clarity. Correlation comparisons are statistically measured using Fisher’s z-transformation. The one issue I have with it is that I assume 2000-2007/8 would have been its own regime, yet the model failed to distinguish between The late 90s and early 2000s. In April 2000, a new regime was very close to being triggered but didn’t. Alas, it is probably better to classify less often than more.
Figure 5: Returns and Vol Regime Comparisons

Figure 6: Stock/Bond and Stock/Dollar Regime Comparisons

Figure 7: Stock/Gold and Stock/Oil Regime Comparisons

Figure 8: Overall Regime Comparison t/Z-Scores (Red = Statistically Significant at 5%)
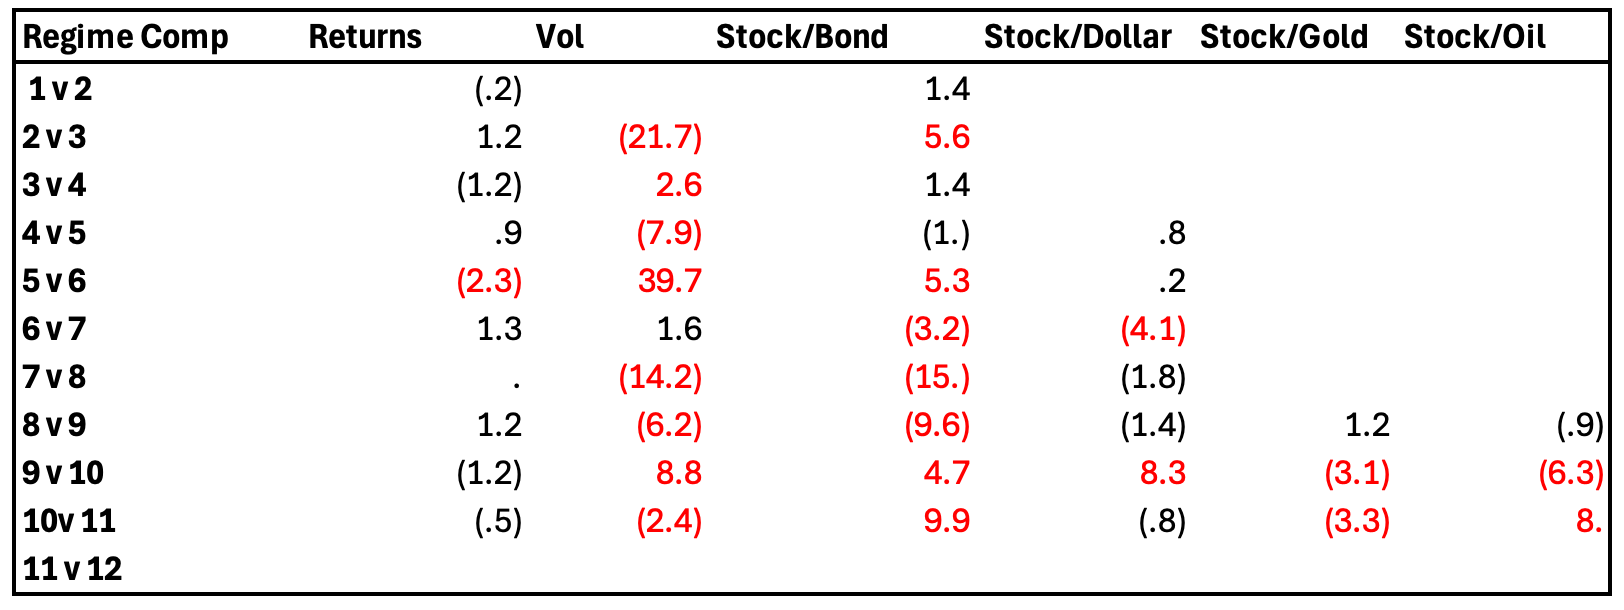
Figure 9: Regime Time Periods (Reprinted For Clarity)

The Future
So, where are we going from here? The model seems to correctly classify regimes rather well. The issue, as I have pointed out, may actually be that the model doesn’t classify regimes enough, not that it is trigger-happy. This does seem to imply a high probability that we are entering a new financial regime.
The implications are massive. As I’ve written before, regime changes tend to hurt systematic strategies and favor discretionary ones—at least at first. Models trained on data from one regime are often miscalibrated in the new one. We saw this during the GFC, when long–value/short–growth factor strategies that had dominated the early 2000s began to unravel, as growth outperformed dramatically in the post-crisis environment fueled by low rates and tech-led momentum. We saw it again post-COVID when models assuming low inflation and bond-equity negative correlation were wrong-footed. And we’re likely seeing it now.
Discretionary traders, by contrast, can observe correlations breaking down and adjust more quickly. They are more flexible in their thinking and actions which can be helpful (averting disaster and understanding the new regime) or hurtful (wrong ideas about what the new regime may be).
In this world, discretionary investors who think in terms of narrative shifts and structural change, and who are armed with the tools to rigorously test their intuitions (like this regime model), will thrive. Systematic investors, too, can adapt—but they need to rethink how much trust they place in historical training sets. Good systematic models should understand when regime change is occuring, understand that past data will be less valuable in a new regime, and learn to decay historical data quicker than they otherwise would. Perhaps the best indication that this idea is valid is the fact that Jim Simons himself often turned off the models at Renaissance Technologies during significant periods of volatility.
So what might this new world look like? With everything so fluid (and my lack of real experience), I don’t weigh my own judgment of these events very highly. However, I think there are a few ways things could change dramatically, beyond what we see during this vol-crisis. Short-term, I am long long-dated bonds as I tentatively think there will have to be quick SLR reform and the Fed will have to step in soon in the long-dated market. If they don’t, I’d be surprised if yields go far higher despite likely tariff-induced inflation because I think we are heading for a significant slowdown in the medium term. I do think the Fed will choose the labor market over inflation. A recent paper written by a Federal Reserve economist3, The Optimal Monetary Response to Tariffs, argued the Fed should ease as tariffs set in. It’s an interesting paper and I think that may ultimately be where the Fed goes. While the Fed is playing hawkish right now, I’d have to imagine they turn soon. However, that’s all speculation!
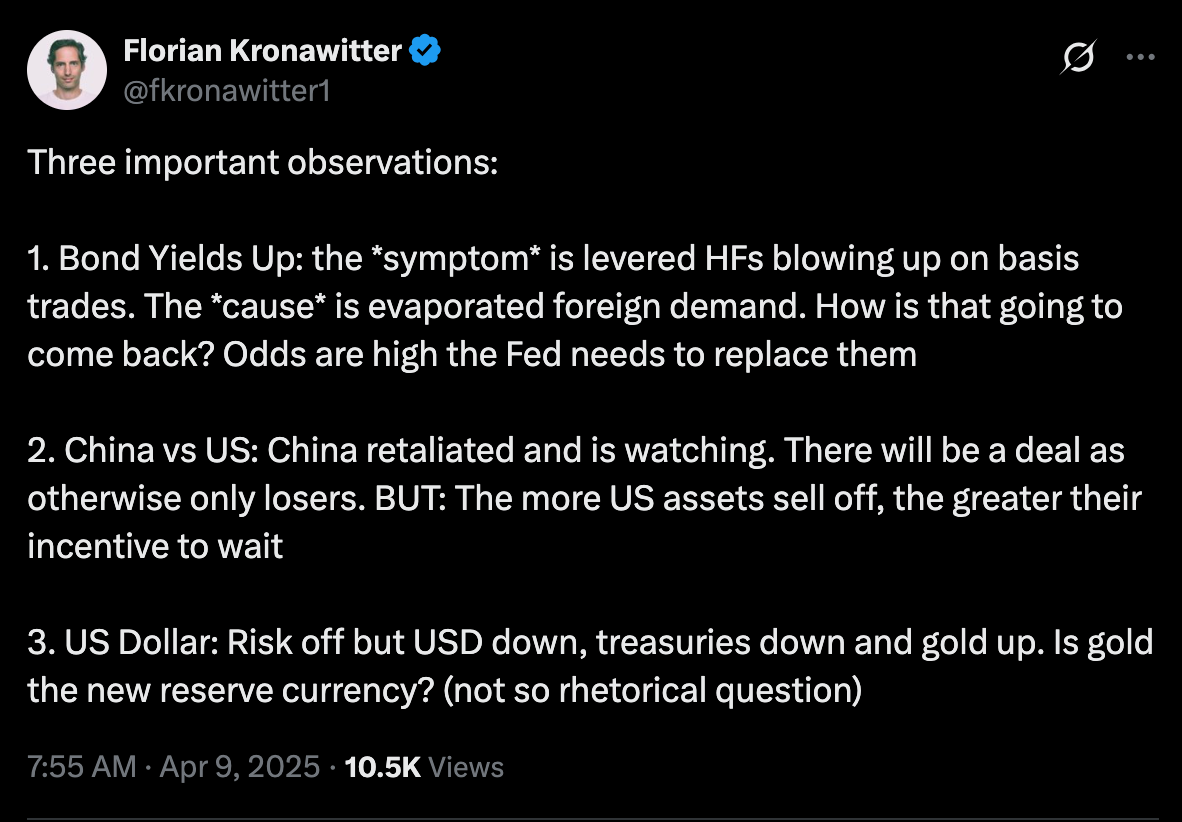
I also think Florian’s analysis below is rather good (and I am fortunate enough to have him as a Subscriber!).
The next step, for me, is to iterate on the model. I want to build a more forward-looking component: something that doesn’t just tell us that a regime change has happened but helps characterize the nature of the new regime early on—to harvest Informational Advantage Alpha. That’s the ultimate goal here: not just to classify the past, but to navigate the future. And perhaps by recognizing that volatility is the signature of change, we can be ready to move faster than the rest and understand when systematic models may perform worse.
Thank you for reading until the end—I really enjoy writing these and I am grateful you all are interested in what I have to say.
- Eli (elinickoll2@gmail.com)
Times of high volatility often have many months in a row of “significant volatility.” To prevent double (or triple) counting these months and making them new regimes, I have decided each regime must last at least six months. So, if there is a high volatility month in January and another one in February, the new regime starts in January, not February. Nor is there two regime changes here as that feels wrong.
One could argue the first regime starts where our data starts, in 1950. But, since we don’t have a fair cutoff for when this first regime starts, it feels more fair to have the first regime start after the first high vol period.
While the research doesn’t necessarily represent the views of the Fed, they definitely read it and perhaps are influenced by it.
Very timely, good stuff